
No-shows are a significant challenge across healthcare, and our optometry practice is no exception. Now in our seventh year of business and seeing patients six days a week, our workload continues to grow. Although our schedule is fully booked every day, the inconsistency caused by no-shows significantly impacts our operations—not to mention our revenue. To address this, we decided to analyze our no-show data in hopes of finding answers to some of our pressing questions and identifying patterns that might help us better manage this issue.
Understanding Our Patient Population and Data Scope
- Insurance Mix: 80% Medicaid/Medicare and 20% employer-sponsored plans.
- Data Period: January 1, 2024, to September 30, 2024.
- Observation Period: October 1, 2024, to December 15, 2024.
- No-Show Rate: 34% (excluding reschedules made less than 24 hours in advance, which are functionally equivalent to no-shows).
Analysis by Gender
To determine if gender played a role in no-show behavior, we calculated the following rates:
- Female No-Show Rate: 33%
- Male No-Show Rate: 35%
The slight difference indicates that gender is not a significant factor influencing no-shows.
New vs. Established Patients
We compared no-show rates between new and established patients:
- New Patient No-Show Rate: 30%
- Established Patient No-Show Rate: 36%
Surprisingly, established patients were more likely to miss appointments.
Further differentiation by visit type: A deeper analysis to distinguish doctor-directed follow-up visits (2 weeks to 6 months) from yearly visits would have been ideal. However, this level of detail required significant manual effort, and time constraints prevented us from pursuing it.
Analysis by Age Group
For additional insight, we examined no-show rates by age group:
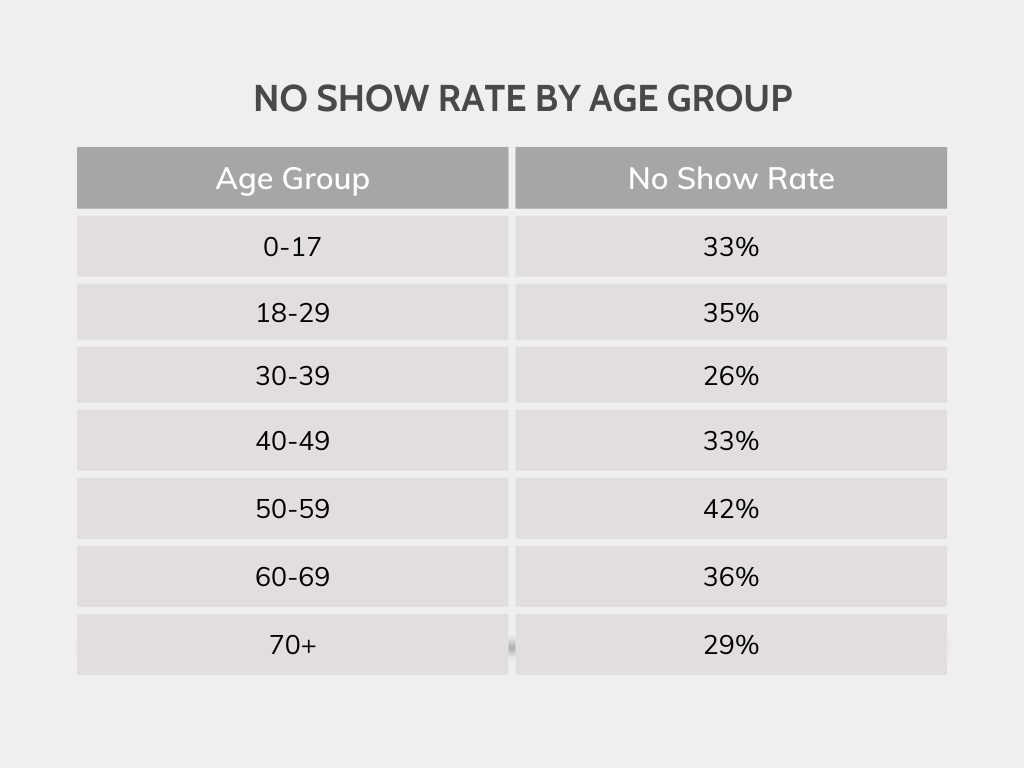
Observations
- Higher-than-expected no-show rates for minors (0-17): We assumed this group would have a lower rate due to parental involvement, but that wasn’t the case.
- Surprising spike in the 50-59 age group: This group had the highest no-show rate at 42%, though the reasons for this remain unclear.
- Surprisingly, patients over 70 were more compliant than age groups 40 – 69.
Besides the data
During a two-and-a-half-month observation period we also wanted to closely monitor the days with the lowest show rates and even the times during the day. Our findings were that warm beautiful fall days negatively affected our show rate and we managed to have a good show rate on the majority of rainy/bad weather days. The election week was extremely quiet with more than 50% no show. Wednesday before Thanksgiving we had a 60% no show rate.
Time of the day
We noticed that our morning is mostly strong with a 85%-90% show rate and almost always 2:30pm – 4:00pm we experience a high no show rate and it significantly slows down in the office with another spike in show rate between 4:00pm-5:30pm.
Key Findings and Actions Taken
Unfortunately, our findings did not reveal clear patterns to make sweeping decisions, and increased schedule monitoring did not produce significant improvements in show rates. During the first month of observation, we saw a modest increase of 0.5 patients per day. However, November’s show rate was heavily impacted by external factors, such as election week, which brought attendance back to the yearly average.
Despite these challenges, we implemented the following strategies to address no-shows and optimize our scheduling:
- Frequent Offender Flags: Patients with repeated no-shows were flagged in our EMR system for better monitoring.
- Elimination of Pre-Scheduled 6-Month Appointments: These patients were transitioned to a 6-month recall list instead.
- Enhanced Follow-Up for 3-Month Appointments: Patients now receive alerts two weeks prior to confirm availability.
- Development of a No-Show Policy for 2025: A structured policy is planned to address no-show challenges more effectively.
Svetlana Golikova, MBA